Trend Following System For Silver
One of the hardest things for beginning investors to learn is that in order to make good money in the markets you need to follow a rigid system. Without a solid system you make too many emotional decisions and they rarely work out in the long run. Whereas, a solid approach that is based on proven methods will often lead to superior returns over time.
There are two crucial elements to successful investing or trading:
#1 – Risk Control (Money Management) – Knowing how big of a position to take in a particular idea or asset class.
#2 – Timing – Knowing when to buy and sell a position
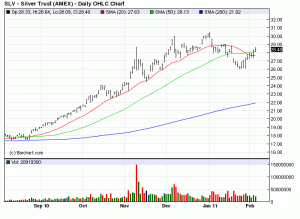
This article will cover a method of timing your entry and exits using the 20,50 and 200 day Simple Moving Averages (SMA). As you can see by the Silver ETF (SLV) chart below when silver really started to run last fall it followed the 20 day SMA very nicely. Before the upside break out it had been bouncing along the 200 day SMA which is often considered to be the ultimate bull or bear indicator.

Source: Barchart.com
As you can see on the left side of the chart SLV tested the 200 day SMA twice and the second time blasted higher closing above all 3 moving averages. Then it left a breakaway gap the following morning. This is a very bullish signal and experienced traders knew it was the beginning of something big. You can see that once the market took off it didn’t test the 20 day SMA for nearly 2 months which is incredible. It followed the 20 day all the way through the end of the year. The market closed below this average the 3rd trading day of January signalling a correction was underway.
Last Thursday the price once again moved above all 3 moving averages. If the 20 day SMA moves back above the 50 day then traders will consider this a renewal of the bull market in silver. If you purchased SLV on a close above the 50 day, you would exit the trade if the market fell below the 20 day SMA again.
