Designing An ETF Portfolio – U.S. Stocks
One of the best ways for the average investor to beat the market is by selecting an asset allocation and then re-balancing the portfolio at the end of each year.
Most investment advisors recommend keeping the stock portfolio to roughly 100 – your age, so if you are 40 years old you would be in about 60% stocks and that would decline to 40% stocks by the time you reach age 60. If you are more aggressive than average you can bump up your stock numbers and if you are more conservative you can reduce them.
So if you are age 40 here is what a sample portfolio might look like:
U.S. Stocks – 30%
Foreign Stocks – 30%
Bonds – 30%
REITs – 5%
Gold or Silver – 5%
Now, how would you build out an investment portfolio that matched this profile? It would seem to me the easiest way for the average person to do it would be either through “no load” mutual funds or ETFs. In this particular example we are going to use ETFs.
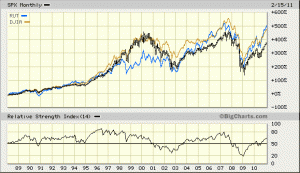
For the U.S. stock portion I would consider splitting up the 30% into 3 different ETFs. These 3 ETFs would track the Dow Jones Industrial Average, The Nasdaq 100 and the Russell 2000. Looking back at data since 1/1988 you can see that these 3 indices have all out-performed the S&P 500 over the past 23 years despite the fact that most money managers compare themselves to the S&P 500. The reason I used January of 1988 as my starting point is because the dust had settled from the huge run up and crash that occurred in 1987.
Here is a chart of the S&P 500 (black bars) compared to the DJIA and the Russell 2000. You can see that both indices have outperformed the S&P over the time frame and the performance gap seems to be widening.
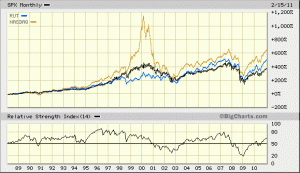
Now, take a look at the same comparison using the Nasdaq instead of the DJIA.
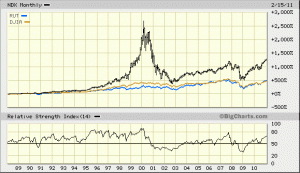
You can clearly see that the Nasdaq has been the best performing of the major stock market indices over the past 23 years. Now, to absolutely blow your mind, I’m going to show you the chart of the Nasdaq 100 which is the largest 100 stocks on the Nasdaq and compare that to the Russell 2000 and the DJIA.
Now, you might think to yourself why not just put the entire U.S. asset allocation into the Nasdaq 100 since that has performed best? Well, the #1 catch phrase when it comes to historical data is that “Past performance does not guarantee future results”. We could be in for a cycle where the S&P 500 outperforms for the next 10 years, no one knows for sure.
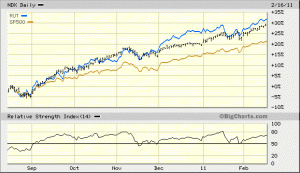
Here is a comparison of the past 6 months that shows the Russell 2000 has performed the best during this tremendous rally.
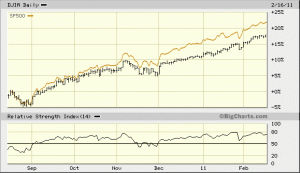
The S&P 500 has also been out-performing the DJIA during this rally.
So it’s best to include several asset classes instead of trying to pick which one will outperform. Therefore, here is an example of how you would structure the U.S. portion of your investment portfolio using an ETF Strategy.
30% – U.S. Stock Allocation
– 10% in DIA (Dow ETF) or SPY – (S&P 500 ETF) or a combination of the two.
– 10% in IWM (Russell 2000 Small Cap ETF)
– 10% in QQQQ (Nasdaq 100 ETF)
By having several classes of stock in your portfolio you will get more benefit from re-balancing. You can see by the long term chart that small cap stocks dramatically under performed in 1999-2002 so you would’ve been buying discounted shares during those years which have soared in recent years.
In the next part we will go through the Foreign and Emerging Market sector of the investment portfolio.

