How To Spot A Buy Signal In Precious Metals – Part 1
When investing or especially trading you want to find correlations within the markets that you can use to determine when a trend will change or whether it will continue in the direction it’s going. This is one thing that has made trading tough the past few years because during the financial crisis most of the correlations broke down. Also, during the recovery there has been so much government and fed intervention in the markets that things haven’t really returned to normal. However, the correlations I’m about to share with you regarding gold and silver are still alive and well.
There are 3 components to the metals markets that you should watch:
#1 The actual price of the metals themselves.
#2 The price relationship between Gold & Silver
#3 How Gold Stocks are performing compared to Gold
For this example we are going to use the Gold ETF – GLD to represent the price of Gold and the Silver ETF – SIVR to represent the price of Silver. I use SIVR instead of the more liquid SLV because the price of SIVR tends to track the front month silver futures more closely than SLV.
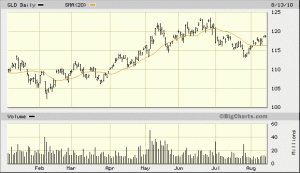
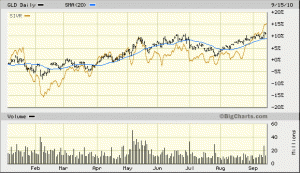
First of all, I look at the Gold and Silver Charts to see what is going on in those markets. You can see by looking at the two charts below that going into August, Gold was beginning to show signs of strength. You can see right at the beginning of August GLD broke above the 20 day simple moving average, then it went down and successfully tested that level and then gapped higher. This is a powerful indicator of a trend change.
At this point Silver (which had underperformed gold since January) was still under performing as a result of the sluggish economy. You can see that as late as mid-August silver was still unchanged (brown line) on the year but gold was up almost 10%.
When gold has been outperforming it’s often a good time to look for a spot to buy silver, because in the end if gold stays strong silver will also rally. If it’s going to be a big rally, the relationship will flip flop and silver will start to outperform gold.
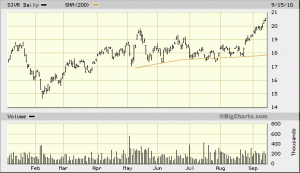
Looking at the charts I noticed that silver had been testing the 200 day Simple Moving Average during it’s consolidation. On Tuesday August 24th the stock market was weak and silver opened down at $17.80 which was once again testing the 200 day sma. At this point gold was up almost 10% on the year but silver was basically flat. When silver rallied off the 200 day simple moving average it was a low risk place to buy silver.
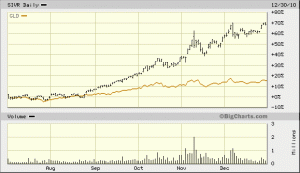
Once silver gapped higher and broke out of the consolidation pattern there was no looking back. The fundamentals of a large short position trying to cover along with the QE2 effects made an explosive combination. However, even if you didn’t know the fundamentals you could’ve seen the situation brewing just by watching the charts. It was clear that this was going to be a huge rally once silver began to dramatically outperform gold. This setup continued to work right into the end of the year.
This is an extreme case, normally the precious metals don’t have this kind of dramatic moves. However, even in more mild times you will see these relationships taking place.
In the next post I will show you how you can use the comparison of Gold Stocks versus Gold to spot turns in the markets.


